Lesson #6: Random forests
(NOTE: this first appeared on Substack here)
Lesson #5 and #6 felt more like data science-y lessons versus actual deep learning, or the sort of stuff I’m most curious about with diffusion models. My sense is that these lessons are mostly Jeremy Howard trying to caution people against deep learning models. Basically: other techniques are much more effective for certain jobs. In particular, you can screw up with pure deep neural nets pretty easily, and you might have a more accurate model if you used a decision tree or random-forest based approach.
My biggest takeaways here are conceptual: the last two lessons can be summarized, essentially, as exploring the power of ensembling. Ensembling, put simply, is combining multiple models together to come to a better decision. There’s a few ways we can do this, like
Random forests,
which come to lower error results by combining multiple models. The idea here is: train a bunch of small, uncorrelated models on different subsets of the data. Because you are using small subsets, you don’t need to split a training and validation set; you can simply use out-of-bag (OOB) error, and evaluate each model on the data it hasn’t seen. Since each sub-model isn’t dependent on the others, and is, as such, biased in a different way, taking their average is likely to give you a better result. Certainly, this means creating many different predictors (but: still probably less intensive than deep learning!), but is also way less sensitive to outliers or overfitting, and, in Howard’s words, way harder to screw up. There’s also
gradient boosting
which is a similarly clever ensembling technique. Basically, you begin with a very weak model that you know will underfit the data. You then add another model afterwards which predicts the error of the first model. You then add another model which predicts the error of the second model, etc etc, and if you sum the results of all of the models, you’ll get something quite close to ground truth, at least in theory.
I love this sort of ‘conceptually clever’ computer science, reminds me a lot of how neat I thought hash tables were the first time I learned them. I’ve already covered the book answers in my last post (for lesson #5) because this was also based on Chapter 9. My biggest note is that I think these video lessons were less useful, mostly because they were focused on optimizing for Kaggle competitions. For example, two of the relevant notebooks here were “Iterate like a grandmaster” and “Road to the top, Part 1” which were largely Kaggle-centered. The relevant tips are just: focus on iterating quickly (and use small models at first to allow you to do this) versus a really elaborate, slow approach.
I’m maybe the target audience here because I am actually data-science-curious and being really handy with data has always been useful in work settings. At some point I’ll probably take some free time to work on Kaggle competitions/get stronger at data science, but it doesn’t feel urgent: I’m here to build diffusion models! Frustrating. My approach, as such, was to basically 80/20 this lesson and get the relevant large takeaways, knowing I’d have enough foundation to come back to this if I really need it in the future.
In the last chapter, I just used a linear model. As such, in spite of my desire, really, to just move on with this chapter, I wanted to train and build a functional (1) random forest, (2) good (and easily interpretable) decision tree and (3) approach with gradient boosting.
Rather than the titanic dataset Jeremy keeps using, I wanted to find another, and found this adult census data table, which is used to predict whether income is >= or < $50k based on a variety of factors. In the interest of time, I built these models mostly using fast.ai’s functionality for them (rather than from-scratch implementations). Below are all of the notebooks I built to play around:
- “Census income random forest,” which I did with the census dataset, here’s my feature importance charts and waterfall chart which similarly show the most important features.

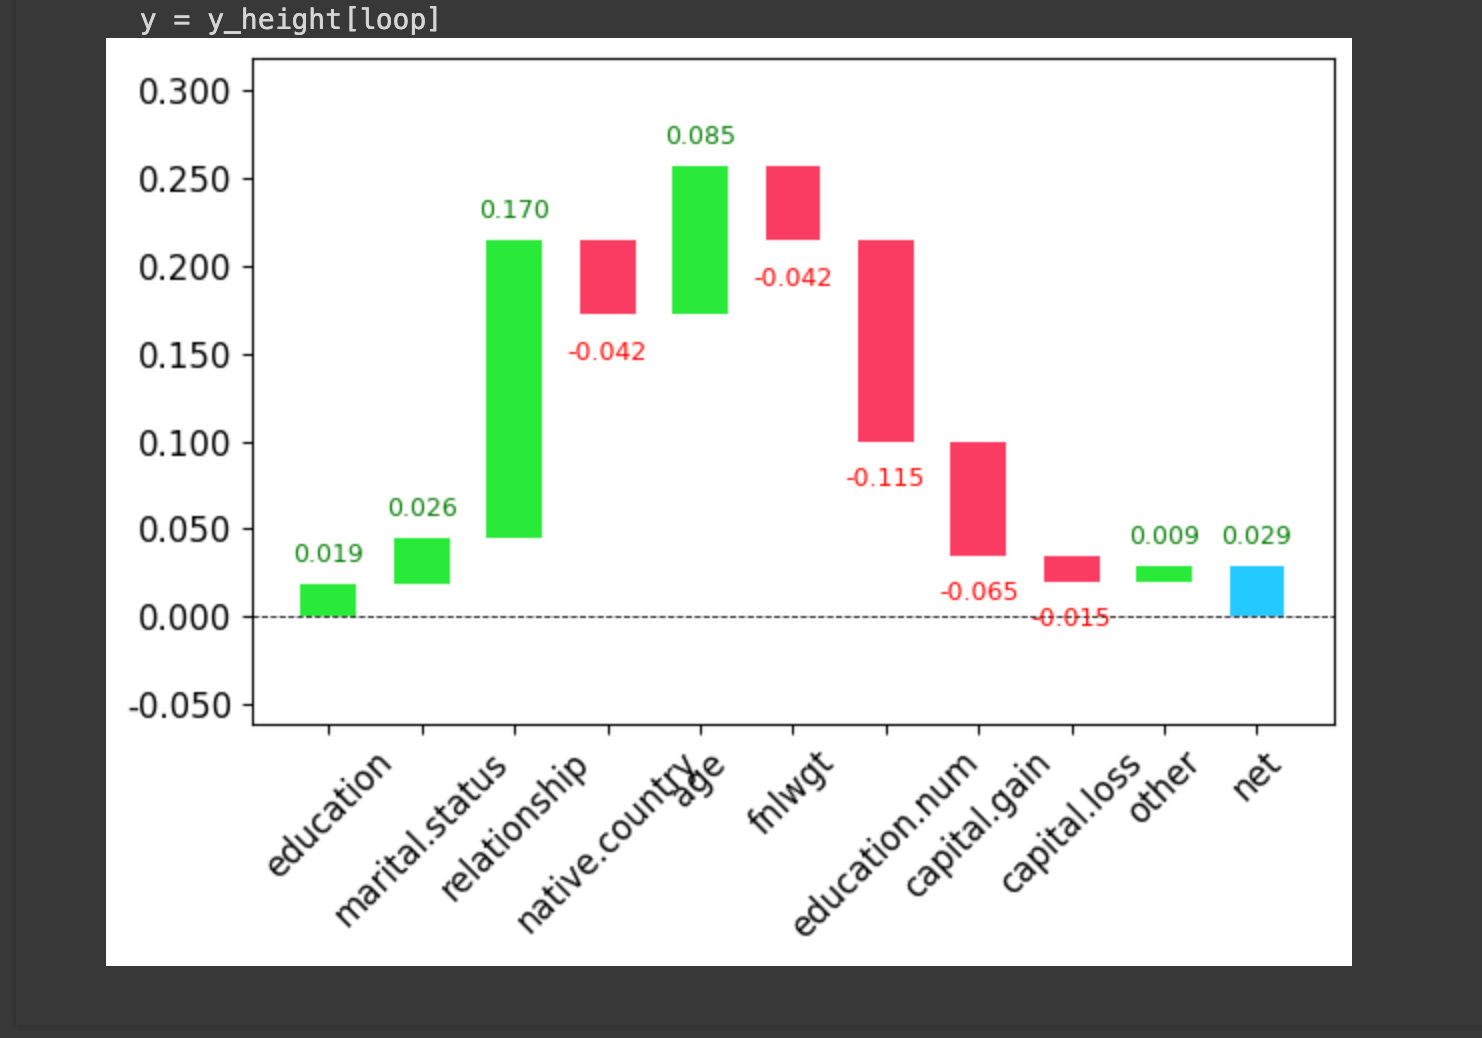
My model is, well, not very good, it seems (out of bag error is in the 0.4 range), but I feel I’m mostly getting bogged down in this lesson, get the gist, and could come back and tinker with similar exploratory data analysis on a real project in the future when I’d need it. I’ll leave it here!
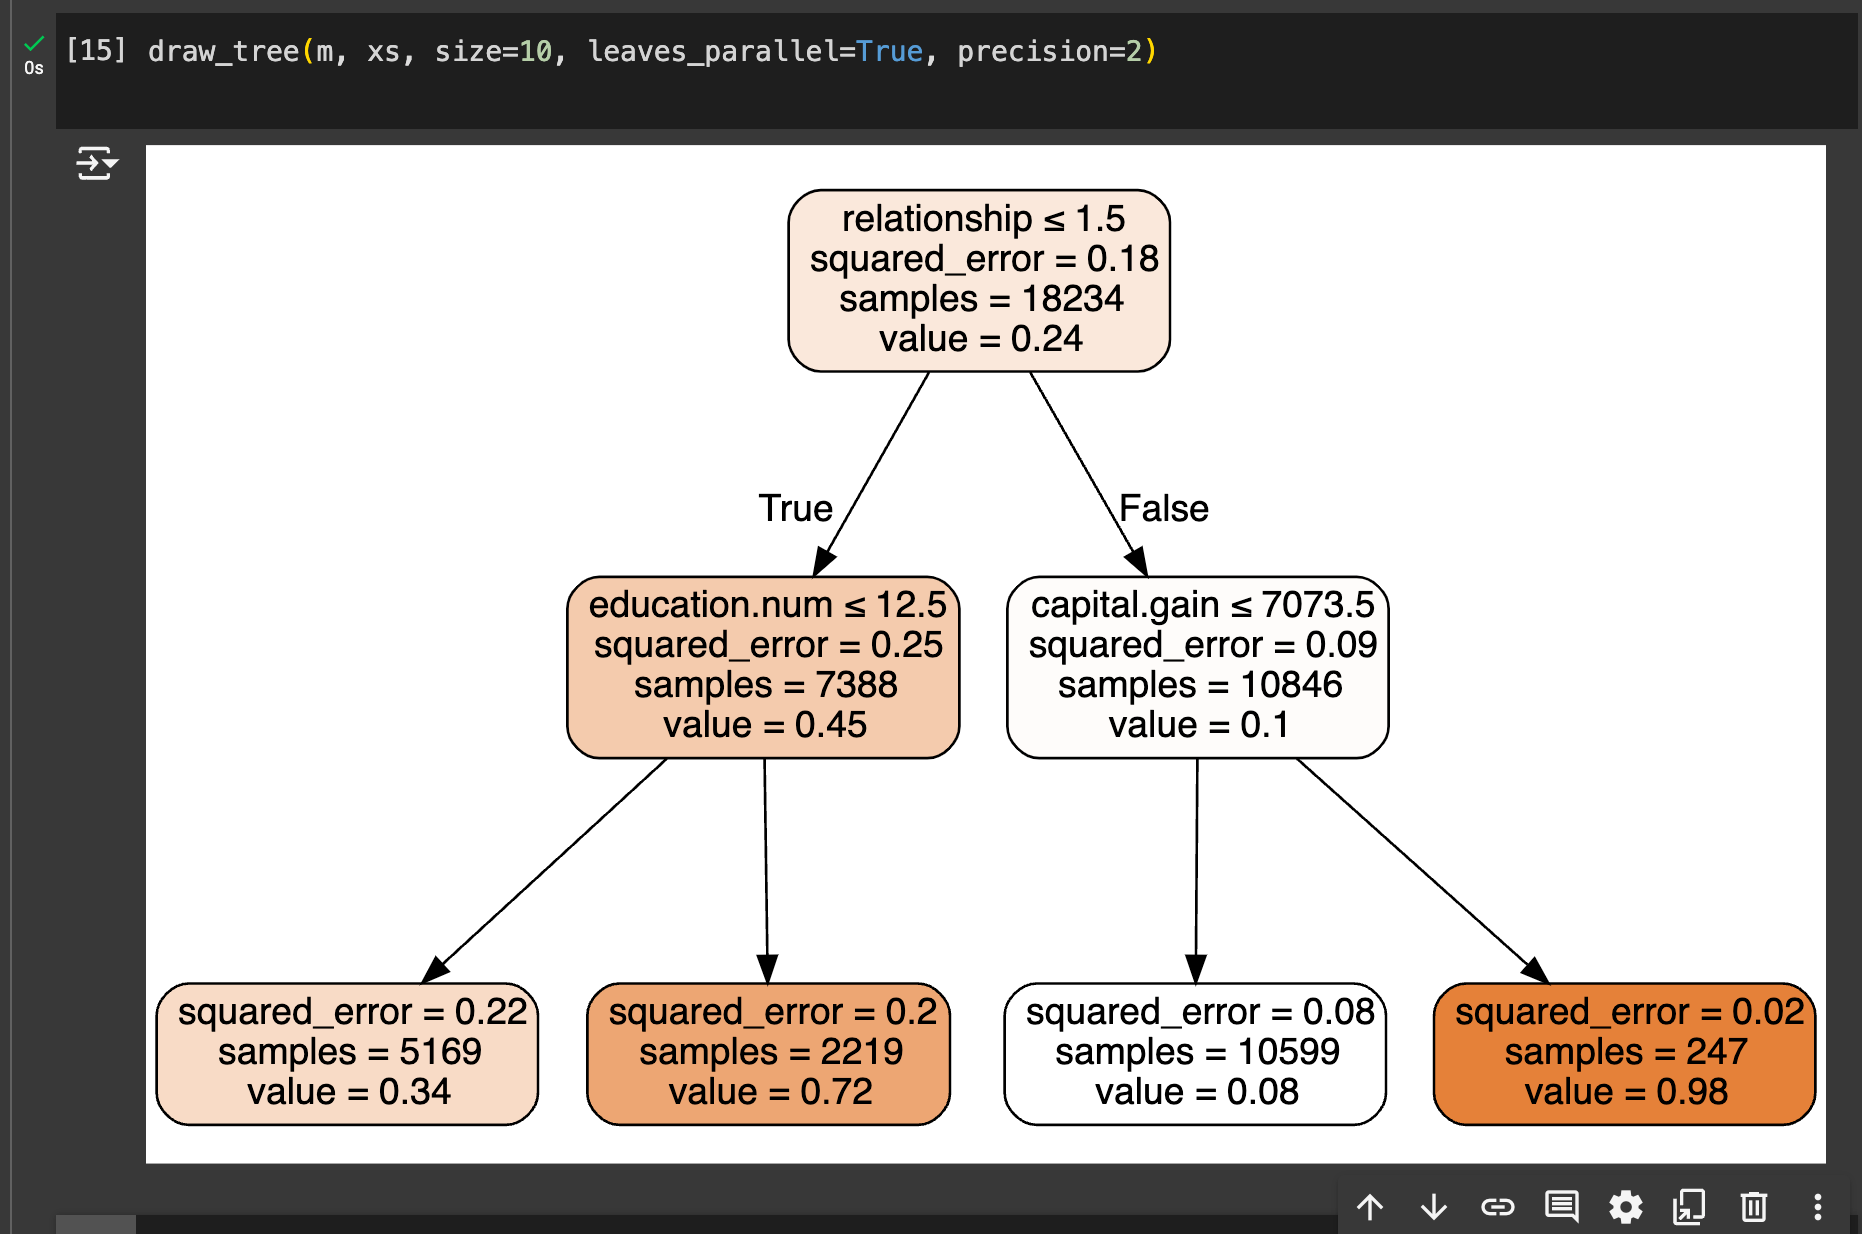
- “Census income decision tree,” which pretty easily allowed me to visualize a lot of the splits:
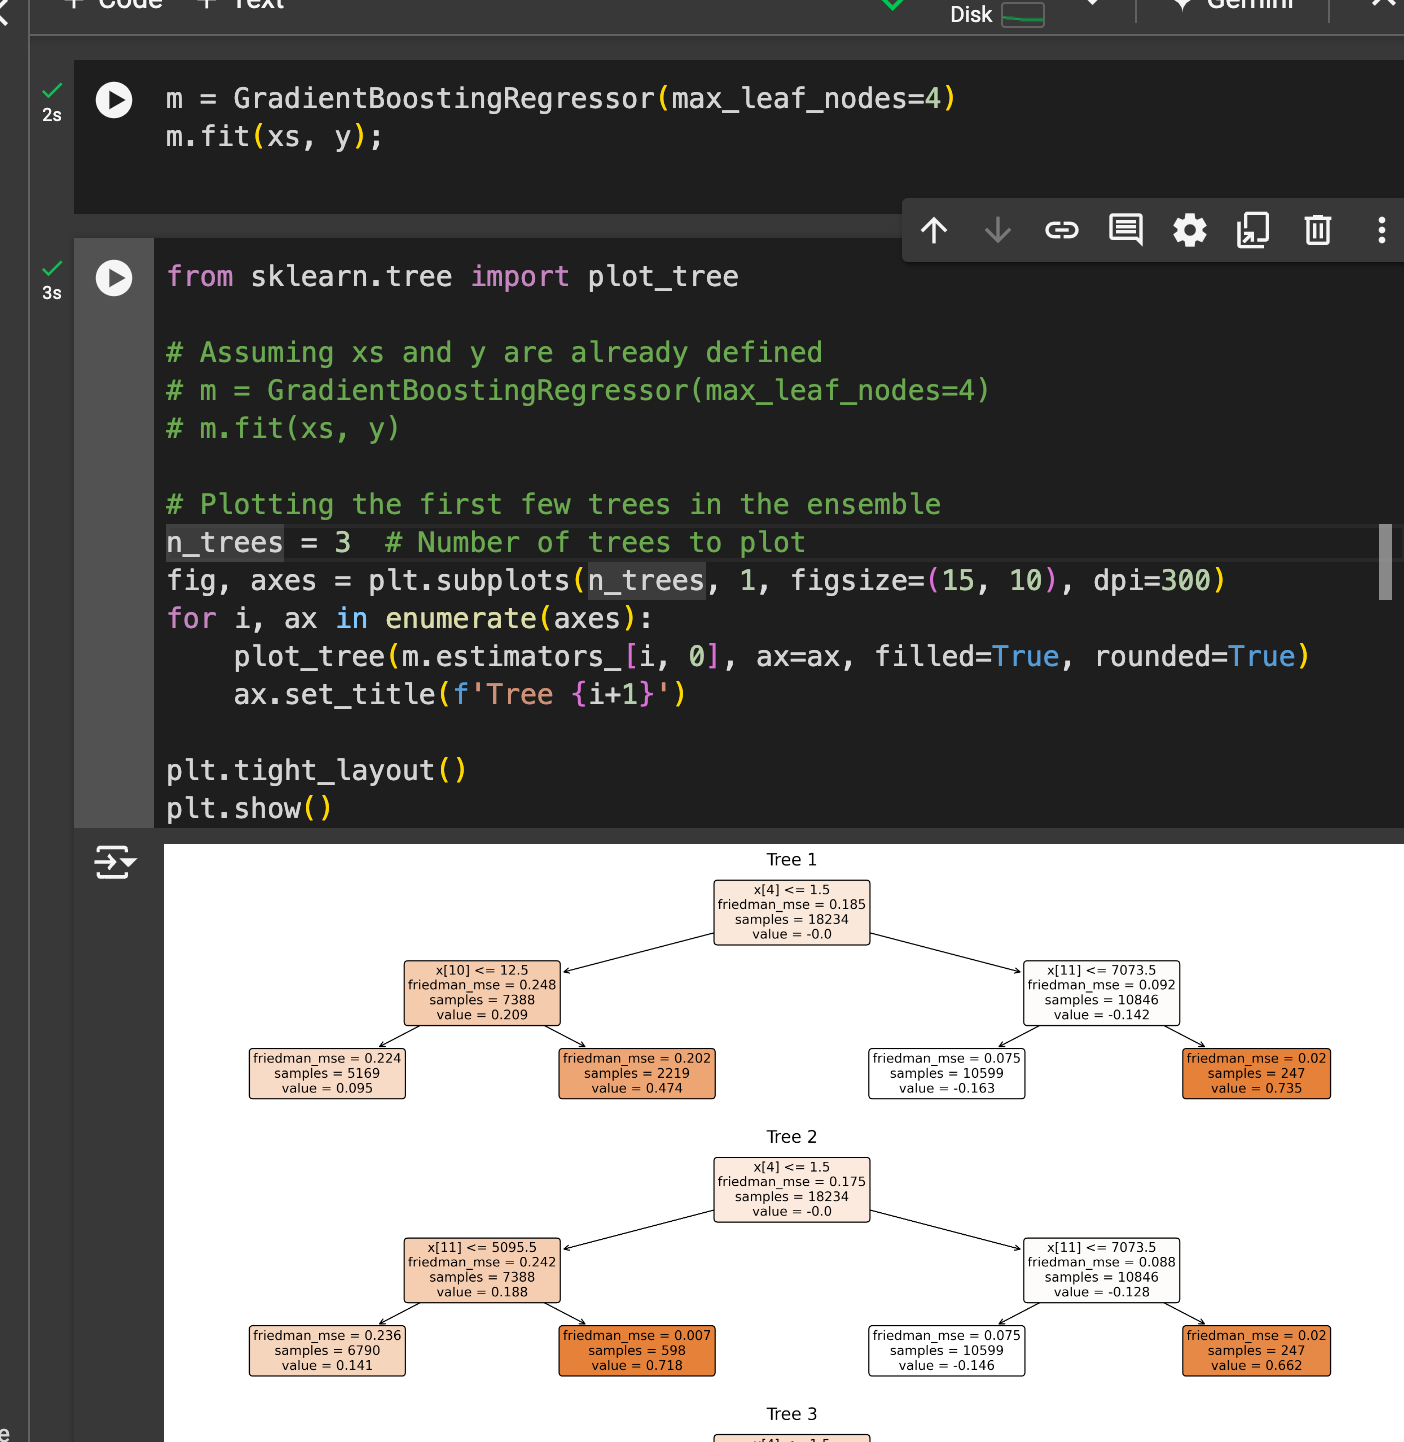
- **“Gradient boosting regressor census data” **which uses the boosting approach. This is essentially a direct copy of my decision tree notebook, but I’m using the GradientBoostingRegressor from sklearn instead of the DecisionTreeJeremy mentions an article he co-wrote called “How to explain gradient boosting,” which I read beforehand. It’s mostly just formalizing the math behind this, and suggesting some of the intuition for why gradient boosting is effective, and why you might pay more attention to the sign vs. magnitude of errors (or why this might make a better model/model that is less sensitive to outliers). There’s nice plotting functionality I found in sklearn to display the results of many of the trees:
I also skimmed “[Statistical Modeling: The Two Cultures](https://www.semanticscholar.org/paper/Statistical-Modeling%3A-The-Two-Cultures-(with-and-a-Breiman/e5df6bc6da5653ad98e754b08f63326c2e52b372)” tl;dr, algorithmic methods work better than traditional statistical methods (duh!) This still remains pretty interesting to me as a theme, particularly reminiscent of some stuff I’ve read about early linguistics where, essentially, the purely data-driven models always outperformed those that were subject to rules/constraints; fitting to the data basically works.
The final interesting thing I read for this lesson was a 2011 WIRED piece about Jeremy Howard called “Accidental Scientist Hawks ‘Online Marketplace for Brains’,” a profile about Kaggle. I’m quite interested / invested in the whole ‘informal science’ career path or the general idea of ‘post-industrial man’ who sorta stumbles informally into other disciplines and organizations. Howard, essentially, rose to the top of the heap simply winning Kaggle competitions for data science, which is pretty cool. It also pitches the allure of all of this: data science (or computer science, broadly) as particularly domain and discipline-agnostic, useful basically everywhere. There’s obviously lots of critique of this (techno-solutionism, etc, lots of epistemic problems) but it remains true that these approaches have clear utility and I’m pretty eager to be comfortable with them.
Anyways: next stop, collaborative filtering! And then almost done with Part 1!